Showing posts with label U.S. Economy. Show all posts

Friday, September 16, 2016

10 Things That Every American Should Know About Donald Trump’s Plan To Save The U.S. Economy - Michael Snyder THE ECONOMIC COLLAPSE BLOG

donald-trump-speech-voa-public-domain

Posted: 15 Sep 2016  Michael Snyder  THE ECONOMIC COLLAPSE BLOG

Can Donald Trump turn the U.S. economy around?  This week Trump unveiled details of his new economic plan, and the mainstream media is having a field day criticizing it.  But the truth is that we simply cannot afford to stay on the same path that Barack Obama, Hillary Clinton and the Democrats have us on right now. 

Millions of jobs are being shipped out of the country, the middle class is dying, poverty is exploding, millions of children in America don’t have enough food, and our reckless spending has created the biggest debt bubble in the history of the planet.  Something must be done or else we will continue to steamroll toward economic oblivion.  So is Donald Trump the man for the hour?

If you would like to read his full economic plan, you can find it on his official campaign website.  His plan starts off by pointing out that this has been the weakest “economic recovery” since the Great Depression…
Last week’s GDP report showed that the economy grew a mere 1.2% in the second quarter and 1.2% over the last year. It’s the weakest recovery since the Great Depression – the predictable consequence of massive taxation, regulation, one-side trade deals and onerous energy restrictions.
And Trump is exactly right about how weak this economic recovery has been.

So how would he fix things?

The following are 10 things that every American should know about Donald Trump’s plan to save the U.S. economy…

#1 Donald Trump would lower taxes on the middle class
The tax savings under Trump’s plan would actually be quite substantial for middle class families.  The following numbers come from a recent Charisma article
• A married couple earning $50,000 per year with two children and $8,000 in child care expenses will save 35% from their current tax bill.
• A married couple earning $75,000 per year with two children and $10,000 in child care expenses will receive a 30% reduction in their tax bill.
• Married couple earning $5 million per year with two children and $12,000 in child care expenses will get only a 3% reduction in their tax bill.

#2 Donald Trump would lower taxes on businesses
Under his plan, no business in America would be taxed more than 15 percent.  Alternatively, Hillary Clinton’s plan would tax some small businesses at a rate of close to 50 percent.  So Trump’s plan would undoubtedly be good for businesses, and it would encourage many that have left the country to return.

But where would the lost tax revenue be made up?

#3 Childcare expenses would be exempt from taxation
For working families with children this would be a great blessing.  Without a doubt this is an effort to win over more working women, and this is a demographic that Trump has been struggling with.

It is definitely an idea that I support, but once again where will the money come from to pay for this?

#4 U.S. manufacturers will be allowed to immediately fully expense new plants and equipment
This would undoubtedly lead to a boom in capital investment, but it would also reduce tax revenue.  As an emergency measure this would be very good for encouraging manufacturers to stay in America, but it would also likely increase the budget deficit.

#5 A temporary freeze on new regulations
Red tape is one of my big pet peeves, and so I greatly applaud Trump for this proposal.  I think that Bob Eschliman put it very well when he wrote the following about Trump’s planned freeze on new regulations…
In 2015 alone, federal agencies issued over 3,300 final rules and regulations, up from 2,400 the prior year. Studies show that small manufacturers face more than three times the burden of the average U.S. business, and the hidden tax from ineffective regulations amounts to “nearly $15,000 per U.S. household” annually. Excessive regulation is costing our country as much as $2 trillion dollars per year, and Trump will end it.
#6 All existing regulations would be reviewed and unnecessary regulations would be eliminated
In particular, Trump’s plan would focus on getting rid of regulations that inhibit hiring.  The following are some of the specific areas that he identifies on his official campaign website
  • The Environmental Protection Agency’s Clean Power Plan, which forces investment in renewable energy at the expense of coal and natural gas, raising electricity rates;
  • The EPA’s Waters of the United States rule, which gives the EPA the ability to regulate the smallest streams on private land, limiting land use; and
  • The Department of Interior’s moratorium on coal mining permits, which put tens of thousands of coal miners out of work.
#7 Donald Trump would fundamentally alter our trade relationships with the rest of the globe
Donald Trump is the first major party nominee in decades to recognize that our trade deficit is absolutely killing our economy.  I write about this all the time, and it is a hot button issue for me.  So I definitely applaud Trump for proposing the following
  • Appoint trade negotiators whose goal will be to win for America: narrowing our trade deficit, increasing domestic production, and getting a fair deal for our workers.
  • Renegotiate NAFTA.
  • Withdraw from the TPP.
  • Bring trade relief cases to the world trade organization.
  • Label China a currency manipulator.
  • Apply tariffs and duties to countries that cheat.
  • Direct the Commerce Department to use all legal tools to respond to trade violations.
#8 Donald Trump’s plan would be a tremendous boost for the U.S. energy industry
Barack Obama promised to kill the coal industry, and that is one of the few promises that he has actually kept.  Obama also killed the Keystone Pipeline, and right now the energy industry as a whole is enduring their worst stretch since the last recession.  To turn things around, Trump would do the following
  • Rescind all the job-destroying Obama executive actions including the Climate Action Plan and the Waters of the U.S. rule.
  • Save the coal industry and other industries threatened by Hillary Clinton’s extremist agenda.
  • Ask Trans Canada to renew its permit application for the Keystone Pipeline.
  • Make land in the Outer Continental Shelf available to produce oil and natural gas.
  • Cancel the Paris Climate Agreement (limit global warming to 2 degrees Celsius) and stop all payments of U.S. tax dollars to U.N. global warming programs.
#9 Trump would repeal Obamacare
Trump claims that Obamacare would cost our economy two million jobs over the next ten years.  And without a doubt, it has already cost the U.S. economy a lot of jobsNot only that, but Obamacare has also sent health insurance premiums soaring, and this is putting a tremendous amount of financial pressure on many families.

Trump says that he would “replace” Obamacare, but that is a rather vague statement.
What exactly would he replace it with?

#10 Trump’s plan says nothing about the Federal Reserve
This is a great concern, because the Federal Reserve has far more power over the economy than anyone else does.  It is at the very heart of our debt-based system, and unless something is done about the Fed our debt bubble will continue to get even larger.
Since the Federal Reserve was created in 1913, the value of the U.S. dollar has fallen by more than 96 percent and our national debt has gotten more than 5000 times larger.  For Trump to not even mention the Federal Reserve in his economic plan is a tremendous oversight.
We are in the midst of a long-term economic decline, and things have not gotten better during the Obama years.  If you can believe it, a study that was just released by Harvard even acknowledges this
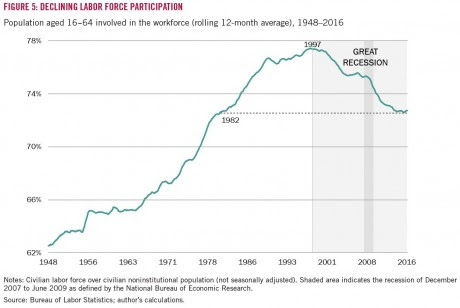
America’s economic performance peaked in the late 1990s, and erosion in crucial economic indicators such as the rate of economic growth, productivity growth, job growth, and investment began well before the Great Recession.
Workforce participation, the proportion of Americans in the productive workforce, peaked in 1997. With fewer working-age men and women in the workforce, per-capita income for the U.S. is reduced.
Median real household income has declined since 1999, with incomes stagnating across virtually all income levels. Despite a welcome jump in 2015, median household income remains below the peak attained in 1999, 17 years ago. Moreover, stagnating income and limited job prospects have disproportionately affected lower-income and lower-skilled Americans, leading inequality to rise.
That same study found that the percentage of Americans participating in the labor force peaked back in 1997 and has been steadily declining since that time…

declining-labor-force-participation-rate-harvard

If we continue to do the same things, we will continue to get the same results.

Donald Trump is promising change, and many of his proposals sound good, but there are also some areas to be concerned about.

Ultimately, just tinkering with the tax code and reducing regulations is not going to be enough to turn the U.S. economy around.  We need a fundamental overhaul of our economic and financial systems, and Trump’s plan stops well short of that.  But without a doubt what he is proposing is vastly superior to Hillary Clinton’s plan, and so he should definitely be applauded for at least moving in the right direction.

Tuesday, August 2, 2016

The Price Of Oil Is Crashing Again, And That Is Very, Very Bad News For The U.S. Economy - Michael Snyder THE ECONOMIC COLLAPSE BLOG

Oil Price Crashing - Public Domain

Posted: 01 Aug 2016   Michael Snyder  THE ECONOMIC COLLAPSE BLOG

This wasn’t supposed to happen.  The price of oil was supposed to start going back up, and this would have brought much needed relief to economically-depressed areas of North America that are heavily dependent on the energy industry.  Instead, the price of oil is crashing again, and that is really bad news for a U.S. economy that is already mired in the worst “recovery” since 1949

On Monday, U.S. oil was down almost four percent, and for a brief time it actually fell below 40 dollars a barrel.  Overall, the price of oil has fallen a staggering 21 percent since June 8th.  In less than two months, the “oil rally” that so many were pinning their hopes on has been totally wiped out, and if the price of oil continues to stay this low it is going to have very seriously implications for our economy moving forward.

One of the big reasons why the price of oil has been declining is because the OPEC nations continue to pump oil at very high levels.  The following comes from CNBC
Production in July by the Organization of the Petroleum Exporting Countries likely rose to its highest in recent history, a Reuters survey found on Friday, as Iraq pumped more and Nigeria squeezed out additional crude exports despite militant attacks on oil installations.
Top OPEC exporter Saudi Arabia also kept output close to a record high, the survey found, as it met seasonally higher domestic demand and focused on maintaining market share instead of trimming supply to boost prices.
These countries don’t know if or when the price of oil will eventually rebound, but what they do know is that they desperately need cash in order to keep their sputtering economies going.  Many of these nations are already experiencing significant economic downturns, and substantially reducing oil revenues at this time would definitely not help things.

Here in North America, oil production costs tend to be higher, and so when the price of oil crashes we tend to see companies shut down rigs.  But when rigs get shut down, that means that good paying jobs are lost.

During the first four months of 2016, approximately 35,000 jobs were lost at Texas energy companies.  Globally, more than 290,000 energy jobs have been lost since the price of oil started falling back in 2014.

And even though there was hope that energy companies would add jobs as the price of oil started rebounding during the second quarter, it turned out that the job losses just kept on coming
Energy companies continued to cut thousands of jobs during the second quarter, even though many chief executives are now voicing optimism that the oil market crash is ending and a rebound in drilling is afoot.
Although the heads of Halliburton Co. , Schlumberger Ltd. and other major firms forecast higher crude prices and a return to U.S. shale fields when discussing earnings this week, those companies and others disclosed another 15,000 industry layoffs.
Personally, I have quite a few members of my own extended family that live in areas that are heavily dependent on the energy industry, and three of them have lost their jobs so far this year.

And these are precisely the sort of good paying middle class jobs that we cannot afford to lose.  In order to having a thriving middle class, you need lots of middle class jobs. 

Unfortunately, those kinds of jobs are going away, and the middle class in the United States is systematically dying.

If the price of oil keeps going lower, that will mean even more jobs losses for the energy industry, and that will be very bad news for the U.S. economy.

In addition, many of these energy companies are getting into very serious debt problems.  Delinquency rates on corporate debt are already the highest that they have been since the last recession as firms struggle to pay their bills.  Of course some of them have already gone belly up, and this has pushed default rates on corporate debt to the highest level since the last financial crisis.

At a price of 40 dollars a barrel, most oil companies in the United States are not profitable in the long-term.  The longer the price of oil stays down in this neighborhood, the more energy companies we will see go bankrupt.  At this point it is just a waiting game.

Also, it is important to keep in mind that Wall Street is very heavily exposed to the energy industry.  Just as subprime mortgages brought down quite a few financial institutions back in 2008, so this time around it is inevitable that the oil crash will claim a fair number of victims as well.

As the global economy has slowed down, the demand for oil has decreased.  And at this point, even the U.S. economy appears to be seriously slowing down.  U.S. GDP only grew at about a one percent rate for the first half of 2016, and the rate of homeownership in this country just hit the lowest level ever recorded.

In the mainstream financial media, there is a lot of hopeful talk about a potential
turnaround for the energy industry, but most of that talk appears to be just wishful thinking.
To me, about the only thing that could push the price of oil back to where U.S. oil companies need it to be in the short-term would be a major war in the Middle East.  And of course that is definitely always a possibility considering who is running things in Washington.  But absent that, it is hard to see the price of oil getting back to 70 or 80 dollars a barrel any time soon.

So that means that we are likely to see more job losses, more debt delinquencies and debt defaults, and more financial institutions getting into trouble due to their reckless exposure to the energy industry.

Friday, April 29, 2016

The U.S. Economy Officially Joins The Global Economic Slowdown – 1st Quarter GDP Comes In At 0.5% - Michael Snyder THE ECONOMIC COLLAPSE BLOG

Slow Down - Public Domain

Posted: 28 Apr 2016   Michael Snyder  THE ECONOMIC COLLAPSE BLOG

Even the government is admitting that the U.S. economy is slowing down.  On Thursday, we learned that U.S. GDP grew at just a 0.5 percent annual rate during the first quarter of 2016.  This was lower than analysts were anticipating, and it marks the third time in a row that the GDP number has declined compared to the previous quarter.  In other words, GDP growth has been declining for close to a year now, and this lines up perfectly with what I have been saying about how the second half of last year was a turning point that plunged us into the early chapters of a brand new economic crisis.  

And as you will see below, the official GDP number is highly manipulated, and the way that it is calculated has been changed numerous times over the years.  So the bad number that is being reported by the government is actually the best case scenario.

Of course many of the “experts” being quoted by the mainstream media are saying that this is just a temporary blip and that good times for the U.S. economy are right around the corner.  For instance, check out this quote from Reuters
“The economy essentially stalled in the first quarter, but that doesn’t mean it is faltering,” said Joel Naroff, chief economist at Naroff Economic Advisors in Holland, Pennsylvania. “Some of the restraints to growth are dissipating. Growth is likely to accelerate going forward.”
We have been told this same story for years, but the “acceleration” has never materialized.  In fact, Barack Obama is poised to become the only president in U.S. history to never have a single year when the economy grew by more than 3 percent during his presidency.

That is a statistic that is hard to believe, but it is true.

In addition, Louis Woodhill has pointed out that the average rate of U.S. economic growth during the Obama years will be the fourth worst in recorded history…
Assuming 2.67% RGDP growth for 2016, Obama will leave office having produced an average of 1.55% growth. This would place his presidency fourth from the bottom of the list of 39*, above only those of Herbert Hoover (-5.65%), Andrew Johnson (-0.70%) and Theodore Roosevelt (1.41%)
So does anyone out there still believe that there has been an “Obama recovery”?

We also need to add another layer to our analysis.  By now, everyone should realize that the official GDP number is highly manipulated, and the way that GDP is calculated has been changed many, many times over the years.

For example, here is Peter Schiff commenting on changes that were made in 2013
The latest example of this was revealed earlier this week when the Bureau of Economic Analysis (BEA) announced new methods of calculating Gross Domestic Product (GDP) that will immediately make the economy “bigger’ than it used to be. The changes focus heavily on how money spent on research and development (R&D) and the production of “intangible” assets like movies, music, and television programs will be accounted for. Declaring such expenditures to be “investments” will immediately increase U.S. GDP by about three percent. Such an upgrade would immediately increase the theoretic size of the U.S economy and may well lead to the perception of faster growth. In reality these smoke and mirror alterations are no different from changes made to the inflation and unemployment yardsticks that for years have convinced Americans that the economy is better than it actually is.
And the following originally comes from a Bloomberg article which discussed changes that were made in 2015
The way some parts of U.S. gross domestic product are calculated are about to change in the wake of the debate over persistently depressed first-quarter growth.
In a blog post published Friday, the Bureau of Economic Analysis listed a series of alterations it will make in seasonally adjusting data used to calculate economic growth. The changes will be implemented with the release of the initial second-quarter GDP estimate on July 30, the BEA said.
One of the changes that was made last year was intended to artificially boost GDP growth numbers for the first quarter of each year.

So without that artificial boost, what would the real number for the first quarter of 2016 look like?

John Williams of shadowstats.com tracks what the official government numbers would be if honest numbers were actually being used, and according to him U.S. GDP growth has been continuously negative since 2005.

But we certainly can’t have the press report those sorts of things.  If that were the case, then everyone would be talking about the “economic depression” that never seems to end.

Unfortunately, the truth is that we are in the midst of a long-term economic decline, and we can see evidence of this all around us.  For example, on Thursday we also learned that the rate of homeownership in the United States has fallen once again, and it is now hovering just 0.1 percent above the lowest level ever recorded in American history…
After gains in the second half of 2015, the homeownership rate fell to just 63.6 percent, seasonally adjusted, in the first quarter of this year, according to the U.S. Census Bureau. Homeownership hit a high of 69.4 percent in 2004, during one of the biggest housing booms in history. That was also when mortgage lending was arguably at its loosest level in history. The homeownership rate is now just one-tenth of 1 basis point higher than its all-time low in the second quarter of 2015.
For many more numbers that show that the U.S. economy has continued to decline, please see the following articles that I authored earlier this month…

#1 “Economy In Decline: Apple Reports Massive Revenue Decline As iPhone Sales Plummet Dramatically
#2 “In 1 Out Of Every 5 American Families, Nobody Has A Job
#3 “Stories Of Despair From The Forgotten People That The U.S. Economy Has Left Behind
#4 “47 Percent Of Americans Cannot Even Come Up With $400 To Cover An Emergency Room Visit
#5 “Corporations Are Defaulting On Their Debts Like It’s 2008 All Over Again

Now that U.S. GDP growth has been steadily dropping for three quarters in a row, hopefully people will wake up and begin to realize what is happening.

We are entering very hard times, so now is not the time to go out and buy fancy new toys or to go into lots of debt.

Rather, this is a time to tighten our belts, batten down the hatches and prepare for rough seas ahead.

Sadly, most people continue to have blind faith that our politicians and the central bankers will be able to perform some kind of miracle to save us from what is coming.

*About the author: Michael Snyder is the founder and publisher of The Economic Collapse Blog. Michael’s controversial new book about Bible prophecy entitled “The Rapture Verdict” is available in paperback and for the Kindle on Amazon.com.*

Friday, April 15, 2016

U.S. Economy 2016: 3 Classic Recession Signals Are Flashing Red - Michael Snyder THE ECONOMIC COLLAPSE BLOG

Red Light - Public Domain

Posted: 14 Apr 2016 Michael Snyder  THE ECONOMIC COLLAPSE BLOG

Those that were hoping for an “economic renaissance” in the United States got some more bad news this week.  It turns out that the U.S. economy is in significantly worse shape than the experts were projecting.  Retail sales unexpectedly declined in March, total business sales have fallen again, and the inventory to sales ratio has hit the highest level since the last financial crisis.  When you add these three classic recession signals to the 19 troubling numbers about the U.S. economy that I wrote about last week, it paints a very disturbing picture.  

Virtually all of the signs that we would expect to pop up during the early chapters of a major economic crisis have now appeared, and yet most Americans still appear to be clueless about what is happening.

Even I was surprised when the government reported that retail sales had actually fallen in March.  Consumer spending is a very large part of our economy, and so if consumer spending is slowing down already that certainly does not bode well for the rest of 2016.  The following comes from highly respected author Jim Quinn
The Ivy League educated “expert” economists expected March retail sales to increase by 0.1%. They only missed by $6 billion, as retail sales FELL by 0.3%. They have fallen for three straight months. At least gasoline sales were strong, as prices have risen 22% since mid-February. That should do wonders for the finances of American households. If you exclude gasoline sales, retail sales fell by 0.4%. As the chart below reveals, the year over year change in retail sales has been at or near recessionary levels for most of 2015, and into 2016.
You can view the chart that he was referring to right here.  In addition to a decline in retail sales, total business sales have also been falling, and this is another classic recession signal.  The following comes from Wolf Richter
Total business sales fell again in February, the Commerce Department reported today. They include sales by manufacturers, retailers, and wholesalers of all sizes across the US economy. This measure is far broader than the aggregate sales by publicly traded companies, which too have been falling.
At $1.284 trillion in February, total business sales were down an estimated 0.4% from January, adjusted for seasonal and trading-day differences but not for price changes. And they were down 1.4% from the already beaten-down levels of February last year. They’re back where they’d first been in November 2012!
Yes, the stock market has been on quite a run for the past several weeks, but that temporary rebound is not based on the economic fundamentals.

The truth is that the real economy is definitely starting to slow down substantially.  If you want to break it down very simply, less stuff is being bought and sold and shipped around the country, and that tells us far more about what is coming in the months ahead than the temporary ups and downs of stock prices.

Another huge red flag is the fact that the inventory to sales ratio in the U.S. has hit the highest level that we have seen since the last financial crisis
The crucial inventory-to-sales ratio, which tracks how long unsold inventory sits around in relationship to sales, is now at a mind-bending 1.41. That’s the level the ratio spiked to in November 2008, after the Lehman bankruptcy in September had put the freeze on the economy.
Inventories represent prior sales by suppliers. When companies try to reduce their inventories, they cut their orders. Suppliers see these orders as sales. As their sales slump, suppliers adjust by cutting their own orders, thus causing the sales slump to propagate up the supply chain. They all react by cutting their expenses. And if it lasts, they’ll cut jobs. Inventory corrections have a nasty impact on the overall economy.
Because sales have slowed down, inventories are starting to pile up to alarmingly high levels.  And when companies see that business is slowing down, they start to let people go.
In a previous article, I told my readers that Challenger, Gray & Christmas is reporting that job cut announcements at major firms in the United States are up 32 percent during the first quarter of 2016 compared to the first quarter of 2015.

Somehow, most of the talking heads on television don’t seem too alarmed by this.
But ordinary Americans are beginning to become alarmed about what is happening.  In fact, the percentage of Americans that believe that the U.S. economy is “getting worse” is now the highest it has been since last August
One of the more glaring examples of how strong pessimism has become is Gallup’s U.S. Economic Confidence Index. The measure gauges the difference between respondents who say the economy is improving or declining. The most recent results are not good.
Fully 59 percent say the economy is “getting worse” against just 37 percent who say it is “getting better.” That gap of 22 percentage points is the worst since August, according to Gallup, which polled 3,542 adults.
Personally, I thought that we would be a little further down the road by now, but without a doubt a new economic downturn has begun in America.

So far, it is less severe than what most of the rest of the planet is experiencing.  Japan’s GDP is officially shrinking, major banks are failing all over Europe, and even CNN admits that what is going on down in Brazil is an “economic collapse”.

It’s funny – yesterday I took time out to write an article about the horrible suffering that ISIS sex slaves are enduring, and a few of my critics took that as a sign that there must not be enough bad economic news to write about.

Well, the truth is that this isn’t the case at all.  The global economic meltdown is steaming along, even if it is moving just a little bit slower than many of us had originally anticipated.  We are moving in the exact direction that myself and many others had warned about, and the rest of 2016 is looking quite ominous for the global economy.

So hopefully everyone (including the critics) is using whatever time we have left wisely.  Because I definitely wish the very best for everyone during the exceedingly hard times that are coming.

*About the author: Michael Snyder is the founder and publisher of The Economic Collapse Blog. Michael’s controversial new book about Bible prophecy entitled “The Rapture Verdict” is available in paperback and for the Kindle on Amazon.com.*

Wednesday, March 16, 2016

We Are Being Killed On Trade – Rapidly Declining Exports Signal A Death Blow For The U.S. Economy - Michael Snyder THE ECONOMIC COLLAPSE BLOG

Abandoned Packard Automobile Factory - Photo by Albert Duce

Posted: 15 Mar 2016   Michael Snyder  THE ECONOMIC COLLAPSE BLOG

Exports fell precipitously during the last two recessions, and now it is happening again.  So how in the world can anyone make the claim that the U.S. economy is in good shape?
 
On my website I have been repeatedly pointing out the parallels between the last two major economic downturns and the current crisis, and I am going to discuss another one today.  Since peaking in late 2014, U.S. exports have been steadily declining, and this is something that we never see outside of a major recession.  On the chart that I have shared below, the shaded gray bars represent the last two recessions, and you can see that exports of goods and services plunged dramatically in both instances…

Exports Of Goods And Services - Public Domain

And this chart does not even show the latest numbers that we have.  During the month of January, U.S. exports fell to a five and a half year low
The U.S. trade deficit widened more than expected in January as a strong dollar and weak global demand helped to push exports to a more than 5-1/2-year low, suggesting trade will continue to weigh on economic growth in the first quarter.
The Commerce Department said on Friday the trade gap increased 2.2 percent to $45.7 billion. December’s trade deficit was revised up to $44.7 billion from the previously reported $43.4 billion. Exports have declined for four straight months.
Because our exports are falling faster than our imports, our trade deficit is blowing out once again.  Every year we buy hundreds of billions of dollars more from the rest of the world than they buy from us, and this is systematically wrecking our economy.  Over the past several decades, we have lost tens of thousands of manufacturing facilities, millions of good paying manufacturing jobs, and major exporting nations such as China have become exceedingly wealthy at our expense.

We are being absolutely killed on trade, and yet very few of our politicians ever want to talk about this.

A brand new study that was recently discussed in the New York Times is bringing some renewed attention to these problems.  It turns out that the promised “benefits” of merging the U.S. economy into the global economic system simply have not materialized…
In a recent study, three economists — David Autor at the Massachusetts Institute of Technology, David Dorn at the University of Zurich and Gordon Hanson at the University of California, San Diego — raised a profound challenge to all of us brought up to believe that economies quickly recover from trade shocks. In theory, a developed industrial country like the United States adjusts to import competition by moving workers into more advanced industries that can successfully compete in global markets.
They examined the experience of American workers after China erupted onto world markets some two decades ago. The presumed adjustment, they concluded, never happened. Or at least hasn’t happened yet. Wages remain low and unemployment high in the most affected local job markets. Nationally, there is no sign of offsetting job gains elsewhere in the economy. What’s more, they found that sagging wages in local labor markets exposed to Chinese competition reduced earnings by $213 per adult per year.
Another study conducted by some of the same researchers discovered that 2.4 million American jobs were lost between 1999 and 2011 due to rising Chinese imports.

When are we going to finally wake up?

The middle class in America is being absolutely shredded, and yet only a few of us seem to care.

Meanwhile, global trade as a whole continues to slow down at a very frightening pace.  We just learned that the China Containerized Freight Index has now dropped to the lowest level ever recorded.  The following comes from Wolf Richter
The China Containerized Freight Index (CCFI), published weekly, tracks contractual and spot-market rates for shipping containers from major ports in China to 14 regions around the world. Unlike most Chinese government data, this index reflects the unvarnished reality of the shipping industry in a languishing global economy. For the latest reporting week, the index dropped 4.1% to 705.6, its lowest level ever.
How many numbers like this do we have to get before we will all finally admit that we are in the midst of a major global economic meltdown?

Here in the United States, the recent rally in the stock market has most people feeling pretty good about things these days.  But the truth is that there are ups and downs during any financial crisis, and this recent rally is putting the finishing touches on a very dangerous leaning “W” pattern that could signal a big dive ahead.

Harry Dent, the author of “The Demographic Cliff: How to Survive and Prosper During the Great Deflation Ahead“, has shown that this leaning “W” pattern is part of a huge “rounded top” for the S&P 500.  The following is a brief excerpt from one of his recent articles
The bull market from early 2009 into May 2015 looks just like every bubble in history, and I’m getting one sign after the next that we did indeed peak last May. The dominant pattern in the stock market is the “rounded top” pattern:

S&P 500 Rounded Top

After trading in a steep, bubble-like channel from late 2011 into late 2014, with only 10% maximum volatility top to bottom, the market finally lost its momentum… just as the Fed finished tapering its QE. That’s because the Fed was the primary driver in this stock bubble in the first place!
Now is not the time to relax at all.

In fact, now is the time to sound the alarm louder than ever.

That is one reason why my wife and I have started up a new television program.  It will be airing on Christian television, but it will also be available on YouTube as well…


As I have said before, 2016 is the year when everything changes.

So don’t be fooled just because the stock market had a couple of good weeks.  The truth is that global economic activity is slowing down significantly, geopolitical instability continues to get even worse, and this political season has caused very deep, simmering tensions in the United States to rise to the surface.

Let us hope that we have a few more weeks of relative stability like we are currently experiencing so that we can have more time to get prepared, but I certainly wouldn’t count on it.

Saturday, December 26, 2015

58 Facts About The U.S. Economy From 2015 That Are Almost Too Crazy To Believe - Michael Synder THE ECONOMIC COLLAPSE BLOG

58
Michael Synder  THE ECONOMIC COLLAPSE BLOG
Dec. 23, 2015

58 Facts About The U.S. Economy From 2015 That Are Almost Too Crazy To Believe


The world didn’t completely fall apart in 2015, but it is undeniable that an immense amount of damage was done to the U.S. economy.  This year the middle class continued to deteriorate, more Americans than ever found themselves living in poverty, and the debt bubble that we are living in expanded to absolutely ridiculous proportions.

Toward the end of the year, a new global financial crisis erupted, and it threatens to completely spiral out of control as we enter 2016.  Over the past six months, I have been repeatedly stressing to my readers that so many of the exact same patterns that immediately preceded the financial crisis of 2008 are happening once again, and trillions of dollars of stock market wealth has already been wiped out globally.

Some of the largest economies on the entire planet such as Brazil and Canada have already plunged into deep recessions, and just about every leading indicator that you can think of is screaming that the U.S. is heading into one.  So don’t be fooled by all the happy talk coming from Barack Obama and the mainstream media.  When you look at the cold, hard numbers, they tell a completely different story.  The following are 58 facts about the U.S. economy from 2015 that are almost too crazy to believe…

#1 These days, most Americans are living paycheck to paycheck.  At this point 62 percent of all Americans have less than 1,000 dollars in their savings accounts, and 21 percent of all Americans do not have a savings account at all.

#2 The lack of saving is especially dramatic when you look at Americans under the age of 55.  Incredibly, fewer than 10 percent of all Millennials and only about 16 percent of those that belong to Generation X have 10,000 dollars or more saved up.

#3 It has been estimated that 43 percent of all American households spend more money than they make each month.

#4 For the first time ever, middle class Americans now make up a minority of the population. But back in 1971, 61 percent of all Americans lived in middle class households.

#5 According to the Pew Research Center, the median income of middle class households declined by 4 percent from 2000 to 2014.

#6 The Pew Research Center has also found that median wealth for middle class households dropped by an astounding 28 percent between 2001 and 2013.

#7 In 1970, the middle class took home approximately 62 percent of all income. Today, that number has plummeted to just 43 percent.

#8 There are still 900,000 fewer middle class jobs in America than there were when the last recession began, but our population has gotten significantly larger since that time.

#9 According to the Social Security Administration, 51 percent of all American workers make less than $30,000 a year.

#10 For the poorest 20 percent of all Americans, median household wealth declined from negative 905 dollars in 2000 to negative 6,029 dollars in 2011.

#11 A recent nationwide survey discovered that 48 percent of all U.S. adults under the age of 30 believe that “the American Dream is dead”.

#12 Since hitting a peak of 69.2 percent in 2004, the rate of home ownership in the United States has been steadily declining every single year.

#13 At this point, the U.S. only ranks 19th in the world when it comes to median wealth per adult.

#14 Traditionally, entrepreneurship has been one of the primary engines that has fueled the growth of the middle class in the United States, but today the level of entrepreneurship in this country is sitting at an all-time low.

#15 For each of the past six years, more businesses have closed in the United States than have opened.  Prior to 2008, this had never happened before in all of U.S. history.

#16 If you can believe it, the 20 wealthiest people in this country now have more money than the poorest 152 million Americans combined.

#17 The top 0.1 percent of all American families have about as much wealth as the bottom 90 percent of all American families combined.

#18 If you have no debt and you also have ten dollars in your pocket, that gives you a greater net worth than about 25 percent of all Americans.

#19 The number of Americans that are living in concentrated areas of high poverty has doubled since the year 2000.

#20 An astounding 48.8 percent of all 25-year-old Americans still live at home with their parents.

#21 According to the U.S. Census Bureau, 49 percent of all Americans now live in a home that receives money from the government each month, and nearly 47 million Americans are living in poverty right now.

#22 In 2007, about one out of every eight children in America was on food stamps. Today, that number is one out of every five.

#23 According to Kathryn J. Edin and H. Luke Shaefer, the authors of a new book entitled “$2.00 a Day: Living on Almost Nothing in America“, there are 1.5 million “ultrapoor” households in the United States that live on less than two dollars a day. That number has doubled since 1996.

#24 46 million Americans use food banks each year, and lines start forming at some U.S. food banks as early as 6:30 in the morning because people want to get something before the food supplies run out.

#25 The number of homeless children in the U.S. has increased by 60 percent over the past six years.

#26 According to Poverty USA, 1.6 million American children slept in a homeless shelter or some other form of emergency housing last year.

#27 Police in New York City have identified 80 separate homeless encampments in the city, and the homeless crisis there has gotten so bad that it is being described as an “epidemic”.

#28 If you can believe it, more than half of all students in our public schools are poor enough to qualify for school lunch subsidies.

#29 According to a Census Bureau report that was released a while back, 65 percent of all children in the U.S. are living in a home that receives some form of aid from the federal government.

#30 According to a report that was published by UNICEF, almost one-third of all children in this country “live in households with an income below 60 percent of the national median income”.

#31 When it comes to child poverty, the United States ranks 36th out of the 41 “wealthy nations” that UNICEF looked at.

#32 An astounding 45 percent of all African-American children in the United States live in areas of “concentrated poverty”.

#33 40.9 percent of all children in the United States that are being raised by a single parent are living in poverty.

#34 There are 7.9 million working age Americans that are “officially unemployed” right now and another 94.4 million working age Americans that are considered to be “not in the labor force”.  When you add those two numbers together, you get a grand total of 102.3 million working age Americans that do not have a job right now.

#35 According to a recent Pew survey, approximately 70 percent of all Americans believe that “debt is a necessity in their lives”.

#36 53 percent of all Americans do not even have a minimum three-day supply of nonperishable food and water at home.

#37 According to John Williams of shadowstats.com, if the U.S. government was actually using honest numbers the unemployment rate in this nation would be 22.9 percent.

#38 Back in 1950, more than 80 percent of all men in the United States had jobs.  Today, only about 65 percent of all men in the United States have jobs.

#39 The labor force participation rate for men has plunged to the lowest level ever recorded.

#40 Wholesale sales in the U.S. have fallen to the lowest level since the last recession.

#41 The inventory to sales ratio has risen to the highest level since the last recession.  This means that there is a whole lot of unsold inventory that is just sitting around out there and not selling.

#42 The ISM manufacturing index has fallen for five months in a row.

#43 Orders for “core” durable goods have fallen for ten months in a row.

#44 Since March, the amount of stuff being shipped by truck, rail and air inside the United States has been falling every single month on a year over year basis.

#45 Wal-Mart is projecting that its earnings may fall by as much as 12 percent during the next fiscal year.

#46 The Business Roundtable’s forecast for business investment in 2016 has dropped to the lowest level that we have seen since the last recession.

#47 Corporate debt defaults have risen to the highest level that we have seen since the last recession.  This is a huge problem because corporate debt in the U.S. has approximately doubled since just before the last financial crisis.

#48 Holiday sales have gone negative for the first time since the last recession.

#49 The velocity of money in the United States has dropped to the lowest level ever recorded.  Not even during the depths of the last recession was it ever this low.

#50 Barack Obama promised that his program would result in a decline in health insurance premiums by as much as $2,500 per family, but in reality average family premiums have increased by a total of $4,865 since 2008.

#51 Today, the average U.S. household that has at least one credit card has approximately $15,950 in credit card debt.

#52 The number of auto loans that exceed 72 months has hit at an all-time high of 29.5 percent.

#53 According to Dr. Housing Bubble, there have been “nearly 8 million homes lost to foreclosure since the home ownership rate peaked in 2004″.

#54 One very disturbing study found that approximately 41 percent of all working age Americans either currently have medical bill problems or are paying off medical debt.  And collection agencies seek to collect unpaid medical bills from about 30 million of us each and every year.

#55 The total amount of student loan debt in the United States has risen to a whopping 1.2 trillion dollars.  If you can believe it, that total has more than doubled over the past decade.

#56 Right now, there are approximately 40 million Americans that are paying off student loan debt.  For many of them, they will keep making payments on this debt until they are senior citizens.

#57 When you do the math, the federal government is stealing more than 100 million dollars from future generations of Americans every single hour of every single day.

#58 An astounding 8.16 trillion dollars has already been added to the U.S. national debt while Barack Obama has been in the White House.  That means that it is already guaranteed that we will add an average of more than a trillion dollars a year to the debt during his presidency, and we still have more than a year left to go.

What we have seen so far is just the very small tip of a very large iceberg.  About six months ago, I stated that “our problems will only be just beginning as we enter 2016″, and I stand by that prediction.

We are in the midst of a long-term economic collapse that is beginning to accelerate once again.  Our economic infrastructure has been gutted, our middle class is being destroyed, Wall Street has been transformed into the biggest casino in the history of the planet, and our reckless politicians have piled up the biggest mountain of debt the world has ever seen.

Anyone that believes that everything is “perfectly fine” and that we are going to come out of this “stronger than ever” is just being delusional.  This generation was handed the keys to the finest economic machine of all time, and we wrecked it.  Decades of incredibly foolish decisions have culminated in a crisis that is now reaching a crescendo, and this nation is in for a shaking unlike anything that it has ever seen before.

So enjoy the rest of 2015 while you still can.

2016 is almost here, and it is going to be quite a year…


LOVE FOR HIS PEOPLE FEATURED BOOK